|
|
|
|
DQChart Control |
|
DQChart
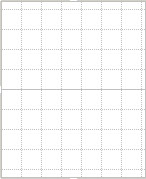
This control is provided to allow basic charting capability. Visually, it looks like a basic grid pattern:

Features:
![]() Plots up
to 16 channels on the same chart.
Plots up
to 16 channels on the same chart.
![]() Allows analog
or digital plotting.
Allows analog
or digital plotting.
![]() Displays
a color legend in the upper left-hand corner of the chart.
Displays
a color legend in the upper left-hand corner of the chart.
![]() Supports
scaling and offsetting via mouse control.
Supports
scaling and offsetting via mouse control.
![]() Supports
WinDaq compatible event markers.
Supports
WinDaq compatible event markers.
![]() Plots a specified
channel from a data stream.
Plots a specified
channel from a data stream.
![]() Limited support
for cursor.
Limited support
for cursor.
Limitations:
![]() Allows only
binary data as input.
Allows only
binary data as input.
![]() The color
allocation for channel, background and grids are not changeable.
The color
allocation for channel, background and grids are not changeable.
![]() Can only
plot one channel or all channels.
Can only
plot one channel or all channels.