|
|
|
|
Power Spectrum Measurements |
|
After the power spectrum is plotted, a moving average filter can be applied for smoothing the spectrum. The moving average utility takes X data points (you specify how many) from the spectrum, adds them together, divides their sum by the total number of data points added, replaces the first data point in the power spectrum with the average value just computed, repeats these steps with the second, third, and so on data points until the end of the power spectrum data is reached. This technique attenuates random, small amplitude frequency spikes often encountered in a power spectrum plot. You control the amount of smoothing by specifying the moving average factor. Available factors are no averaging (1) or factors of 2, 3, 4, 5, 6, 8, 10, 12, 16, 20, 24, 32, 40, and 48. With a power spectrum displayed, the spectrum can be smoothed as follows:
![]() In
the Transform menu click on Average Power….
In
the Transform menu click on Average Power….
![]() Choose
Transform Average Power… (ALT,
T, A).
Choose
Transform Average Power… (ALT,
T, A).
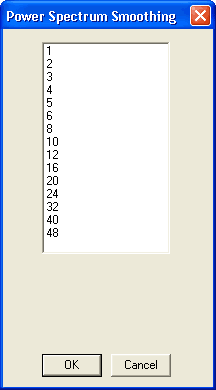
This displays the Power Spectrum Smoothing dialog box.

Highlight the smoothing factor (or number of points to be averaged) and click OK. The smoothing factor chosen is displayed in the analysis reporting area.
![]()
![]()
![]()
![]()
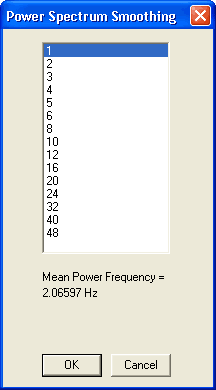
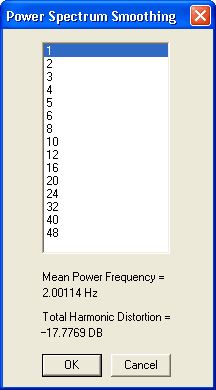
The Power Spectrum Smoothing Dialog box can also display the Mean Power Frequency and the Total Harmonic Distortion.
The Mean Power Frequency usually provides a better estimate of the frequency of the strongest peak than the frequency value displayed at the highest peak. It does reflect any erased frequencies, so high-pass or low-pass filtering can be applied to remove other peaks before estimating the frequency of a peak.
To view the Mean Power Frequency re-access the Power Spectrum Smoothing dialog box.
![]() In
the Transform menu click on Average Power….
In
the Transform menu click on Average Power….
![]() Choose
Transform Average Power… (ALT,
T, A).
Choose
Transform Average Power… (ALT,
T, A).
The Mean Power Frequency will be displayed.

Total Harmonic Distortion (THD)
Display the Total Harmonic Distortion in the Power Spectrum Smoothing dialog box.
1. If the data cursor is not displayed, check Options Data Cursor.
2. Set Edit Compression to 1. Locate the waveform of interest in strip 1 by typing 1= and the channel number (see Variable Waveform Assignments). Click in the bottom annotation line to drag the cursor to the start of a cycle (preferably at a zero crossing or other place where the slope is steep), and set Time Marker by pressing F4 once or twice until ".000 SEC (TM)" is displayed. If necessary scroll forward before dragging the vertical line cursor to a position one sample to the left of the start of a subsequent cycle, then use Transform DFT to perform a Discrete Fourier Transform on an integral number of cycles.
3. If the crosshair cursor is not already positioned there, click in the frequency plot and drag the vertical hair horizontally until the horizontal hair lies on the peak of the component you consider to be the fundamental. If the crosshair cursor disappears, click in the frequency plot to make it reappear. If the frequency plot is compressed, as indicated by (/2) or other compression factor following the crosshair frequency displayed in the annotation line, the accuracy of the calculation will be improved by using Transform Compress FRQ to change Frequency Compression to 1. This does not reposition the crosshair cursor to the expanded fundamental peak, so if you change Frequency Compression, scroll the frequency if necessary and reposition the crosshair.
4. If Power Spectrum Smoothing is not 1, change it to 1.
5. Access the Power Spectrum Smoothing dialog box.
![]() In
the Transform menu click on Average Power….
In
the Transform menu click on Average Power….
![]() Choose
Transform Average Power… (ALT,
T, A).
Choose
Transform Average Power… (ALT,
T, A).

If you want to improve the Mean Power Frequency estimate by erasing frequencies using High Pass Filter or Low Pass Filter, record the Total Harmonic Distortion first, since that value is affected by erasing frequencies. Total Harmonic Distortion is displayed in decibels relative to the fundamental unless Mag Engr Units is checked, in which case it is displayed as a percentage of fundamental power. Measurement accuracy improves as more samples are transformed, but beyond 8192 samples the DFT resorts to input averaging, which attenuates higher order harmonics.