
 View Cart
 sales@dataq.com
 330-668-1444
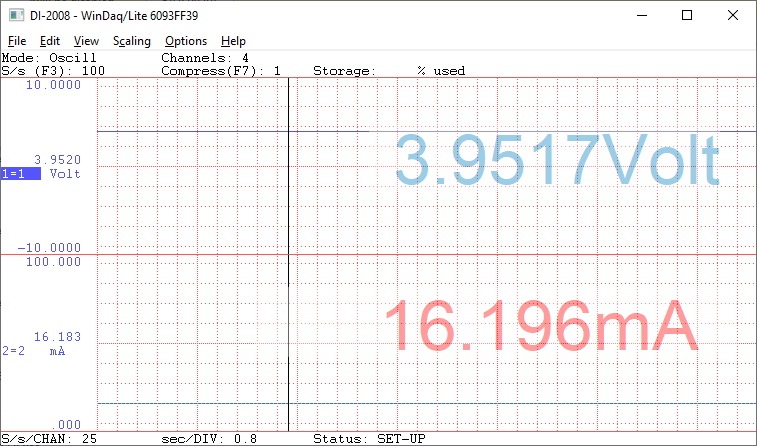
The question often arises, “Is there a way to display the actual values in WinDaq?”. While real-time numerical data is displayed in WinDaq data acquisition software along with a real-time graph, some customers might prefer to display data in a larger “meter-style” graphical format.
Fortunately, there’s a WinDaq add-on that allows you to do just that!
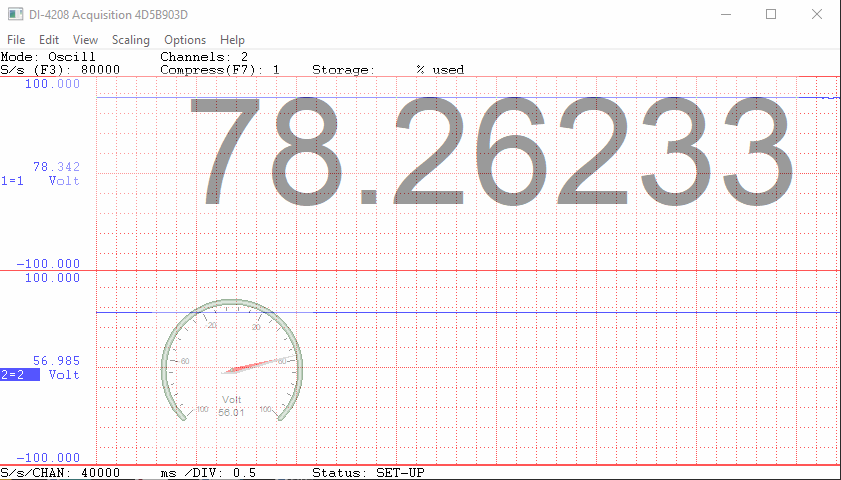
UltimaSerial, a third-party company with close ties to DATAQ, has created the Magic Meter add-on. With customizable window sizes and font colors, high and low-level alarm indicators and the ability to perform real-time arithmetic calculations, the add-on offers WinDaq users a versatile, meter-style display.
In this application note, we’ll guide you through the Magic Meter installation, demonstrate key features and show you how to display the real-time numerical data being generated by WinDaq, in a clean, customizable display.
Begin by download the WinDaq add-on package and following the installation instructions at:
lhttp://www.ultimaserial.com/Download.html
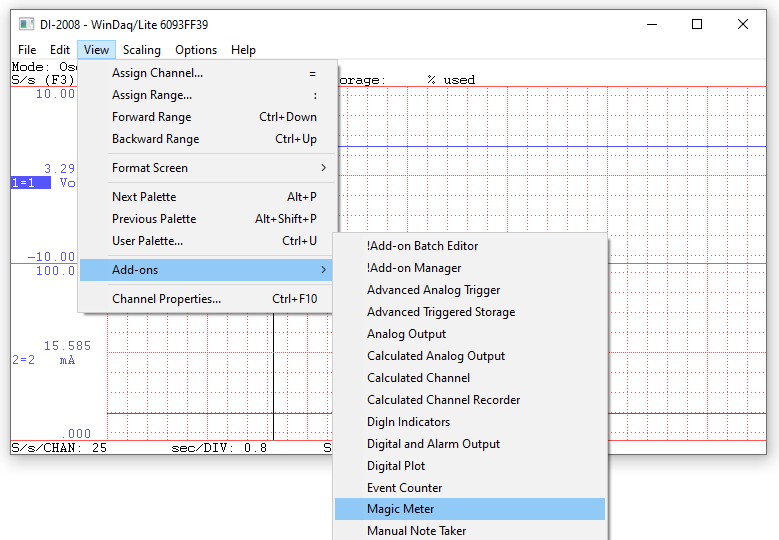
Once installed, launch the WinDaq Data acquisition software, and choose ‘Add-ons’ from the ‘View’ pull-down menu, and select ‘Magic Meter’ (View>>Add-ons>>Magic Meter).
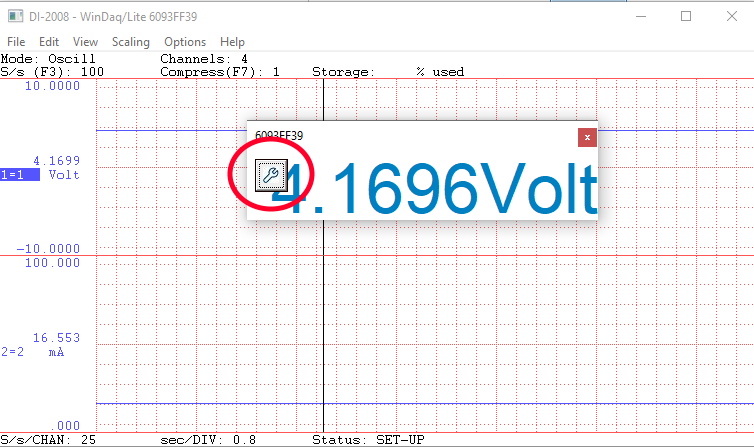
Upon launching the Magic Meter add-on, you’ll see a meter display window containing the real-time value on channel 1 (the current highlighted channel).
Hover over the upper left-hand corner of the window to display the ‘Setting’ button (as shown below), and left-click on it.
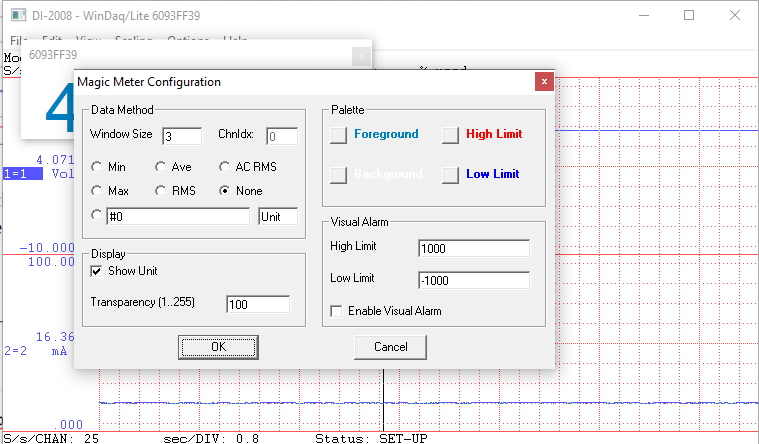
Here you can choose the size of the meter window, change the color pallet and even select alarm levels, generating a visual alarm when signals rise above or fall below the thresholds entered.
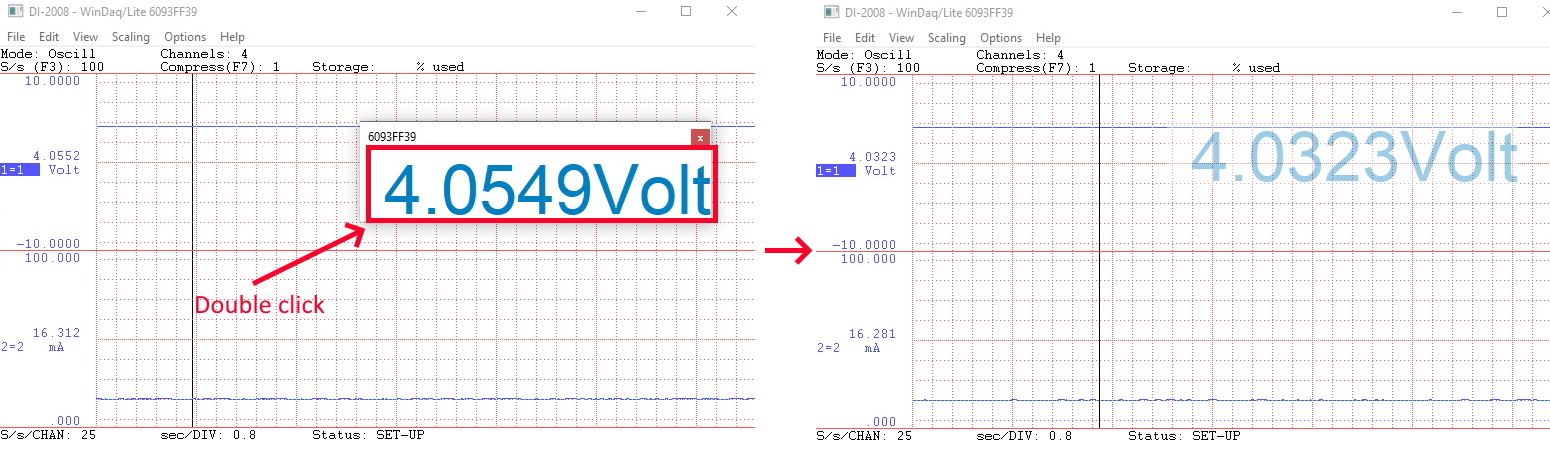
With Magic Meter configured, double click anywhere in the window to superimpose the live meter readout.
The Magic Meter add-on provides a clean, straight forward solution for those seeking a meter-style display in WinDaq.
Be sure and check out the full assortment of UltimaSerial add-ons at http://www.ultimaserial.com/wdspectrum.html
Follow Us![]()
![]()
![]()
![]()
![]()
![]()
![]()
![]()