
 View Cart
 sales@dataq.com
 330-668-1444
As you may know, Python is a popular high-level programming language, used by professional data analysts and novices alike. Pandas is a data analysis library, or set of tools that can be used inside of Python. The Pandas tools allow for quick and intuitive analysis of a dataset.
Adding Python (and Pandas) to Microsoft Excel, greatly increases the speed and efficiency with which you can derive useful information from your data. But how do you get that data into Microsoft Excel?
As we’ve discussed in previous posts and videos, our ExcelLink add-on for WinDaq does just that!
Now that you know how to get data into Microsoft Excel, how do you integrate Python into Excel? And how in the world do you write a program to analyze that data?
In September 2023, the Microsoft Office 365 Insider Program announced that Python programming was coming to Excel. Not only did they mention it, they included a fully-functional Python module in their Beta Channel. So while the official release is still a ways off, Microsoft 365 Insider users can get a head start using this exciting new data analysis tool!
Getting Started
If you’re already using Microsoft 365 apps, click here to learn how to install Microsoft 365 Insider on your Windows machine.
Click here to update Office 365, adding beta channel modules.
With Microsoft 365 Insider installed and the beta channel modules added, restart Microsoft Excel, and you’re ready to get started with Python in Excel!
Data Analysis
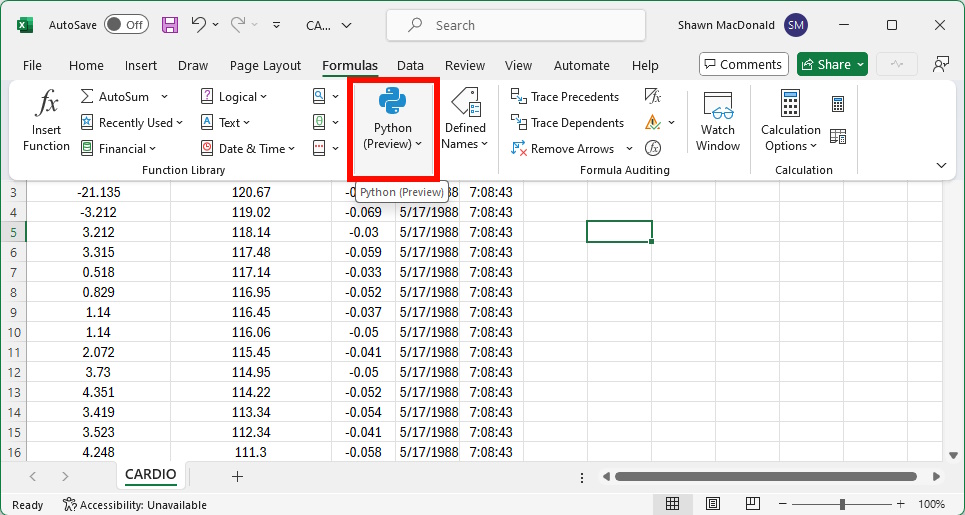
To give you an idea how Python in Excel works, we’ll open an existing dataset in Excel, and click the ‘Formulas’ tab.
Immediately, you’ll notice a new Python option (see below).
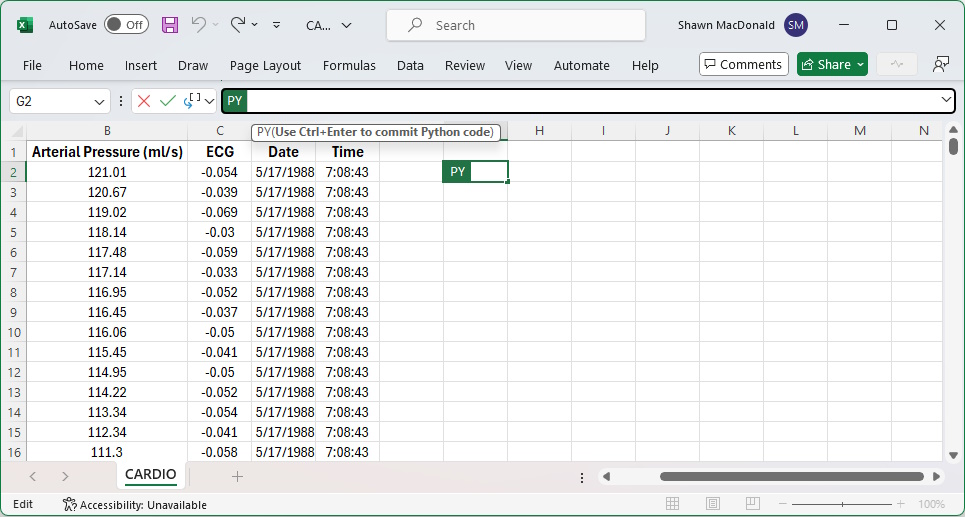
Clicking the Python button, and choosing ‘Insert Python’, the Formula box becomes a Python box!
The first thing we’ll do, is select some data for Python to work with.
You’ll do this just as you ordinarily would in Excel; left click, hold and drag.
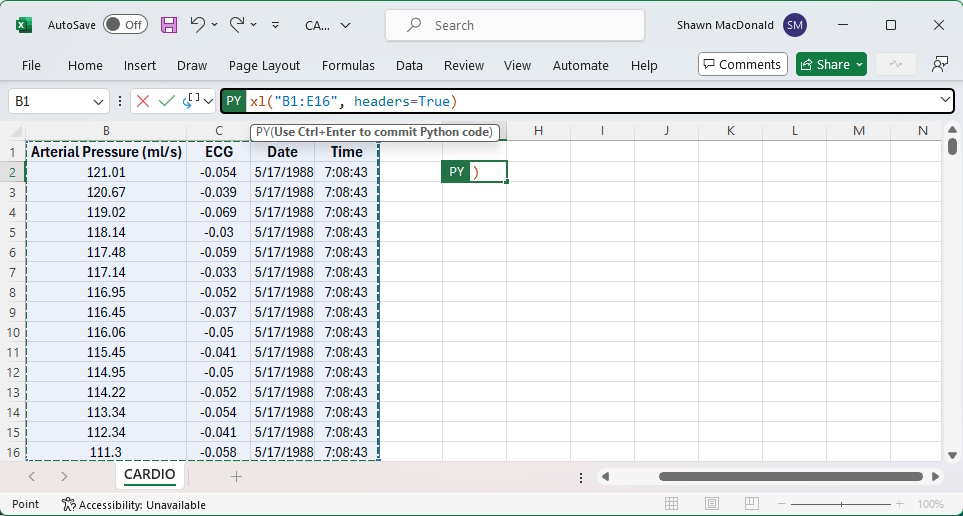
With the selection made, we’ll press Ctrl+Enter to create DataFrame, containing the data that we selected.
Choosing the ‘Excel Value’ option, we can actually see the data contained inside of the DataFrame (see below).
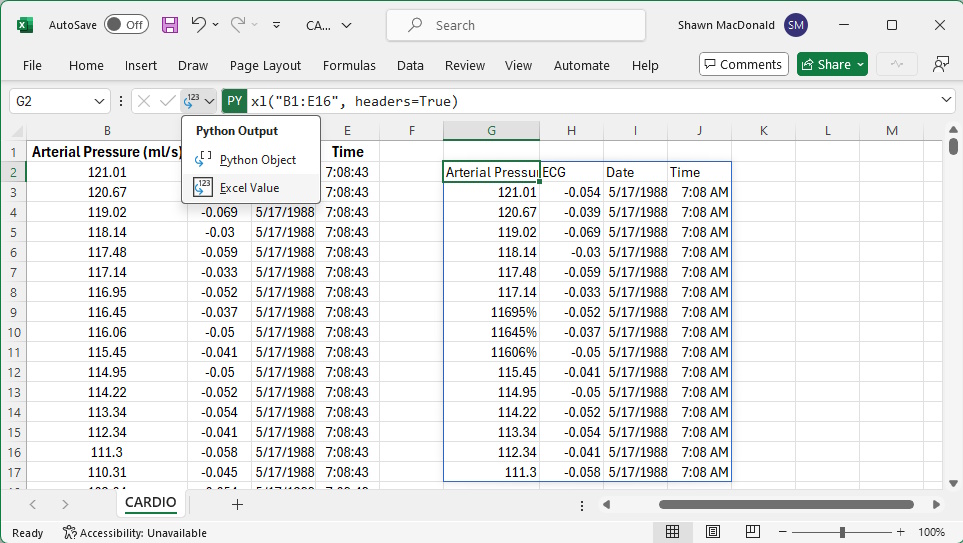
To save space, we’ll choose to display it as a Python object (DataFrame). To make dealing with the data a little easier, we’ll assign it a name, “df” in this case.
Now that we have some data for Python to analyze, what next?
Pandas
With data inside of a Python DataFrame, we’ll use a Pandas analysis too called ‘describe’ to derive some basic information from our dataset.
To do so, we’ll create a second Python cell. And since Python executes commands from left to right and top to bottom (the same way you would read a book), we’ll place the new Python cell underneath our existing DataFrame.
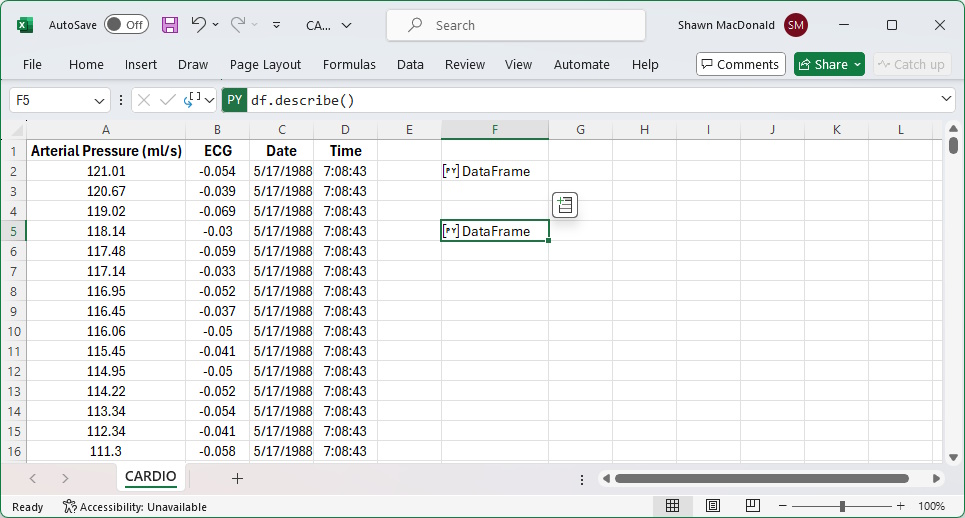
To use the ‘describe’ Pandas tool, we’ll type df.describe(), and press Ctrl+Enter to execute (see below).
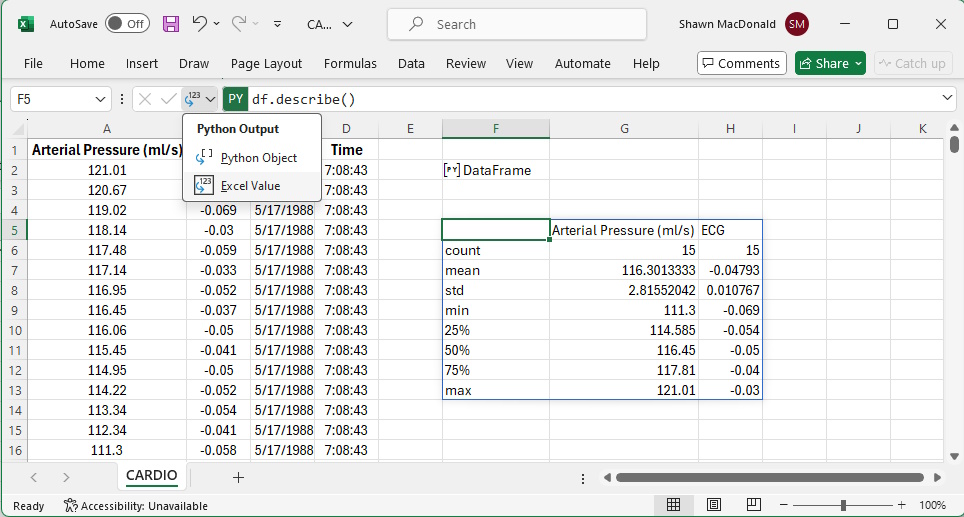
Choosing ‘Excel Value’ from the Python Output pull-down menu, we can see that the ‘describe’ tool give us basic analytics, like mean, std (standard deviation), min and max, etc.
The ‘describe’ tool is one of many in the Pandas toolbox. Learn more about Pandas at https://pandas.pydata.org/.
Follow Us![]()
![]()
![]()
![]()
![]()
![]()
![]()
![]()