View Cart
 sales@dataq.com
 330-668-1444
Data Acquisition in Excel, Python, Pandas and Anaconda...
ExcelLink is your ultimate data engine for Python in Excel
Exciting news from the Microsoft Office 365 Insider Program: The most popular AI/ML language, Python programming, is coming to Excel! This powerful integration allows you to harness the capabilities of the Pandas library, enabling seamless data analysis and manipulation. By leveraging OpenAI's ChatGPT and Anaconda, users can create customized Python programs directly within Excel for a wide array of data analysis tasks..
While the official release of Python in Excel is still on the horizon, now is the perfect time to get a head start. Python is already a leading language in AI programming, making this integration a game-changer for data enthusiasts and professionals alike.
Don't miss out on this cutting-edge toolset! Here's an example to help you get started and join the forefront of data innovation with ExcelLink and be prepared to elevate your data analysis capabilities with Python in Excel.
1. Turn on Beta Channel for your Office 365
2. Update Office 365 to bring in Beta Channel modules
3. Restart Excel and acknowlege the Beta Insider program. Please make sure you open Excel as the registered user. If your are not (such as an authorized user by school IT dept), you may not have the license/permission to use the Beta Channel
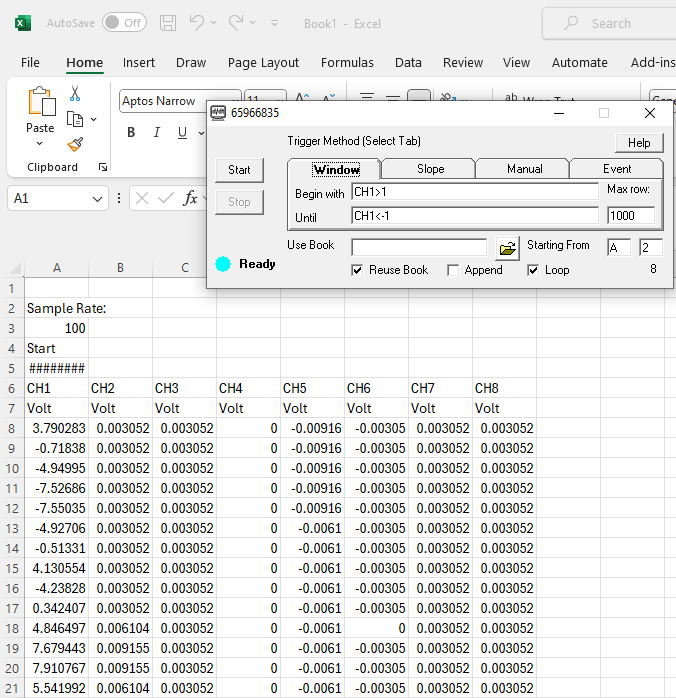
4. For entry level hardware to collect data, consider DI-1100XL . Use WinDaq and ExcelLink to collect a block of real world data like voltage and pressure
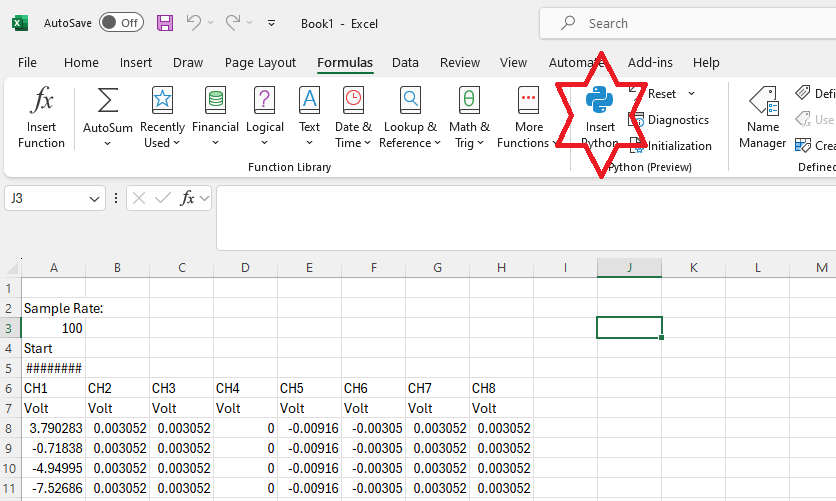
5. In an empty cell, follow Formulas->Insert Python. Or you can type in "=PY(" to activate Python window
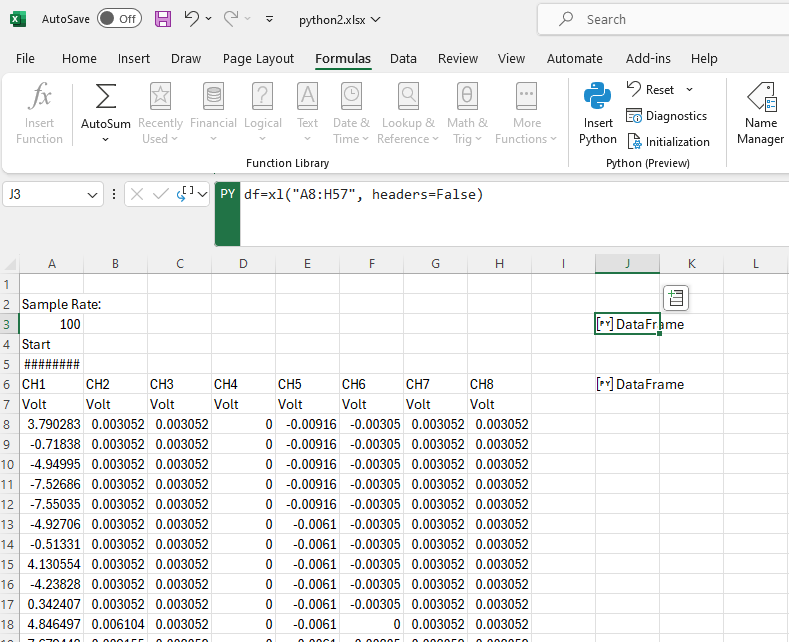
6. Once you see the PY tag (indicating Python editor), select the data block (use CTRL+SHIFT+DOWN to select to the end of data). In our example, we modify it to df=xl("A8:H57", headers=False) so that we can reference the dataframe in next step as df. Press CTRL-ENTER to execute it
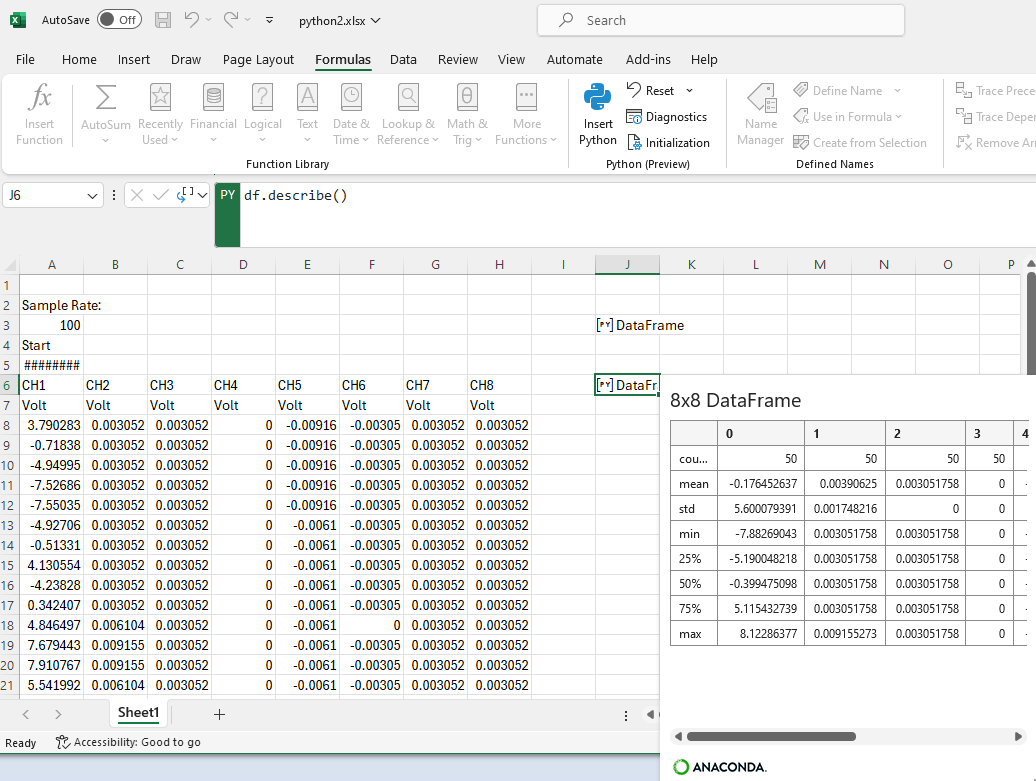
7. Since Python execution order is LEFT->RIGHT and TOP->BOTTOM, we pick an empty cell below to insert another Python code. Enter the code "df.describe()" to calculate the result. For more info about Pandas library, please click here
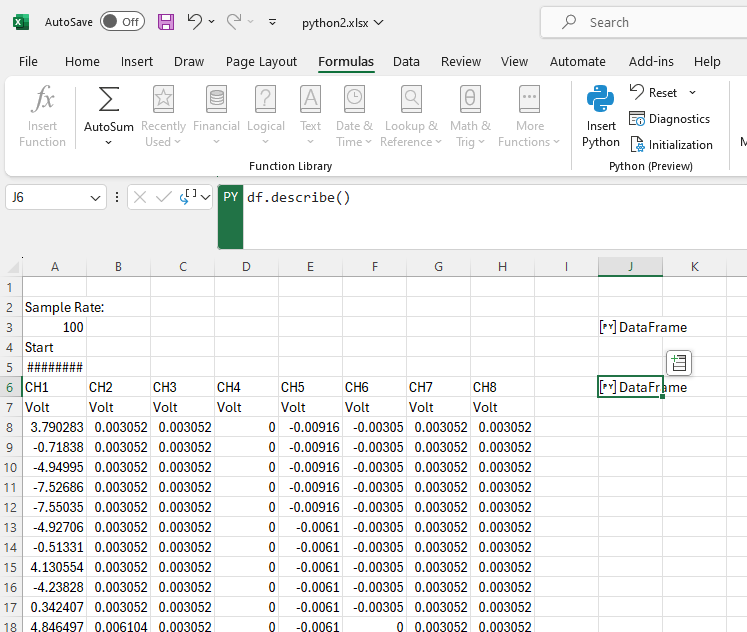
8. Press CTRL-ENTER to execute Python codes. After that, click on the second Python cell to view the result, which is a description of the data, such as mean, standard deviation, min, max. If you need help to write Python codes to provide more info about the data, ask ChatGPT
9. Save the Excel work sheet so that you can reuse it as template (Use Book) in the future