
 View Cart
 sales@dataq.com
 330-668-1444
Electromyogram (EMG) Waveform Analysis Software with Advanced CODAS
With the advent of data acquisition systems, acquiring data from real-world applications has never been easier, more accurate, or more reliable. Once acquired, the data file can be examined and analyzed just as easily. In some applications, the data requires little or no analysis. Simply reviewing the acquired data reveals the desired information. In other applications, you must analyze the acquired data to derive the desired or meaningful information.
The electromyogram (EMG) is an example of this latter application. When a muscle is contracted, a small electric potential is produced. Surface electrodes can sense this muscle activity potential when placed over the muscle. The signal detected by the electrodes is amplified and recorded with instrumentation, and is known as the EMG. To the researcher, the EMG signal is virtually meaningless "as is." However when the signal is analyzed, a measure of work done by the muscle, called an activity index, can be derived. In practice, an activity index for a specific muscle is established as a benchmark. This benchmark is then compared to another activity index of the same muscle, but generated under a different set of conditions (such as after fatigue, or after the administration of a drug, etc.). This comparison normalizes the activity index and provides a way of measuring the effect fatigue or the drug had on the muscle. The primary tools used to analyze the acquired EMG signal are the rectification and integration functions.
The Advanced CODAS waveform analysis option for DATAQ Instruments' WinDaq data acquisition systems contains the rectification and integration functions that were used for analysis in this application note.
Problem Solving with Integration
Integration is a mathematical tool used to obtain the area under a curve. The applications for determining the area under a curve in science and technology are numerous. For example, suppose we have two generic waveforms as shown in the top channel of Figure 1 and we need to know which waveform contains more energy. Can you determine which waveform contains more energy just by considering their physical appearance? The waveform on the left is much taller than the one on the right, however it is much thinner. Conversely, the waveform on the right is much wider than the one on the left, but it is not as tall. So which waveform contains more energy? The only sure way to find out is by integrating both waveforms to determine area under the curve. The bottom channel of Figure 1 shows both waveforms after integrating. In this respect the integral is used as a comparative tool. The waveform that has the largest area under the curve also contains the most energy. In our example, the waveform on the left contains more energy since its peak integral value is larger than the one on the right.
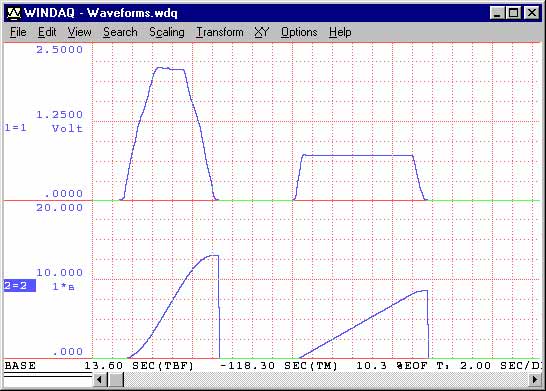
Figure 1 — The two generic waveforms are shown in their original condition in the top channel and as integrated waveforms in the bottom channel. Note that the integrated waveform on the left has a larger peak integral value, which means it contains more energy than the waveform on the right. Without integration, this determination is not obvious.
The units that result from an area-under-the-curve calculation are the same as those that would result from any area calculation. For example, the area of a tract of land 85 feet wide by 170 feet long is 14,450 feet•feet, or simply square feet. An area bounded by a curve is no different. A waveform representing volts as a function of time in seconds would carry units of volt•seconds when integrated.
An EMG Application
Deriving an activity index from an EMG waveform is a specific application of the integral. The following example illustrates how the rectification and integration functions of Advanced CODAS are applied to an EMG channel to derive an activity index. The EMG signal shown in Figure 2 was obtained from a bioelectric amplifier connected to a pair of surface electrodes placed several centimeters apart over the biceps muscle. The signal was acquired with a WinDaq data acquisition system installed in a Toshiba Portable personal computer. The output of the bioelectric amplifier was connected to the input of the WinDaq board through an option 01 module and a total gain of 1000 was applied using the live, interactive program capabilities of WinDaq acquisition software. A sample rate of 1000 samples per second provided better than 100Hz response. This is similar to the best response that could be achieved with a pen-type oscillographic chart recorder. Figure 2 shows the acquired EMG signal with a compression factor of 16 applied, equivalent to slowing down a chart recorder's paper speed by a factor of 16.
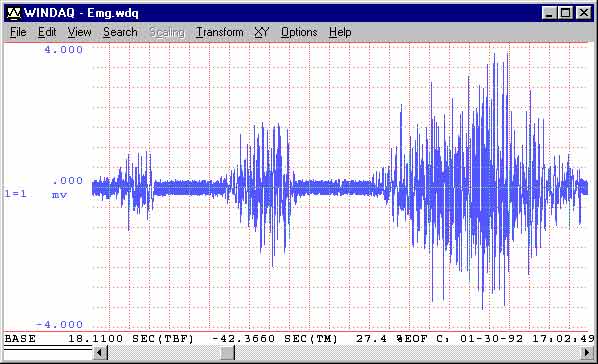
Figure 2 — The original EMG signal acquired by skin surface electrodes placed several centimeters apart over the biceps muscle. Other than the duration and intensity of the muscular contraction, the waveform conveys little meaningful information in this state.
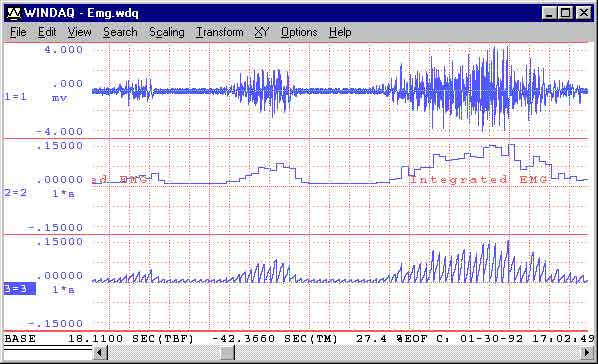
Figure 3 — Channels 2 and 3 illustrate the activity index waveform. The Channel 2 shows the activity index with sample/hold enabled, while Channel 3 shows the activity index with sample/hold disabled.
From the original signal (shown in Figure 2), the absolute value or full-wave rectified waveform can be derived. Applying the absolute value function to a waveform folds the negative portion of the signal above zero reference to join the positive half of the signal. Full-wave rectification is desirable in this case since we are interested in knowing the total amount of energy (both positive and negative) contained by the waveform. Applying half-wave rectification would result in a positive only or negative only energy evaluation.
When this is done, you may notice a noisy appearance in the baseline. This noise is typical of an EMG waveform and should be removed before integration. Our next step would be to eliminate this baseline noise and achieve a standard or normal form of the signal. This can be done so subsequent comparisons with other normalized signals will reveal the difference in muscle performance rather than differences due to noise levels. The unwanted baseline noise can be removed by shifting the rectified signal below zero reference (just enough to submerge the band of noise under zero), re-establishing zero at the baseline, and then taking the positive half-wave rectification of the re-zeroed signal. By taking the positive half-wave rectification of this re-zeroed signal, all portions of the signal below the zero reference line (the noise) will be blocked out. It should be noted that this step is really not necessary for integration. The integration function of Advanced CODAS supports rectification directly, but it does not display the rectified signal as an intermediate result. Our reason for presenting the rectified signal is to document the steps involved in an EMG analysis.
The top channel of Figure 3 illustrates our objective, the activity index waveform derived from the original input signal. This waveform is scaled from 0 to 0.1 millivolt•seconds, has a peak value of 0.07824 millivolt•seconds, and at any 100 millisecond interval has a discrete value that is directly related to the original signal less noise. The integral was reset every 100 milliseconds (or every 100 samples) and the "sample/hold" before reset function was enabled.
The sample/hold feature holds the previously integrated value on the display until the next integral value is calculated and displayed. It also masks the reset transitions of the integrated waveform, resulting in an uncluttered step-like histogram display. If the sample/hold feature is disabled, the reset transitions are displayed. The top channel of Figure 3 illustrates our integrated EMG waveform with sample/hold disabled. Note how the displayed reset transitions clutter the display. As you can see, the advantage of enabling the sample/hold feature is that it makes the integrated waveform easier to interpret. The disadvantage of enabling sample/hold is that it delays the integrated waveform from the original input waveform by one cycle. This is because the sample/hold feature needs to know the value of the integral before it can hold the display at this value. Since we are only interested in the peak integral value, this delay is of little consequence, so the uncluttered display is preferred. For complete information on the waveform integral utility, refer to DATAQ Instruments' Application Note number A Closer Look at Waveform Integration with Advanced CODAS.
By itself, one integrated EMG waveform is of little or no value in evaluating muscle activity. However when compared to a similarly evaluated EMG waveform, it is easy to tell which case represents the greatest amount of work done by the muscle. If you are interested in analysis beyond just the peak integral value, the powerful statistics function of WinDaq may be applied to further analyze and interpret the waveform data. The statistics function derives statistical information from the waveform, such as: number of data points contained in the waveform, mean value, standard deviation, minimum value, median value, maximum value, rms, sum, sum of squares, variance, and skewness.