
 View Cart
 sales@dataq.com
 330-668-1444
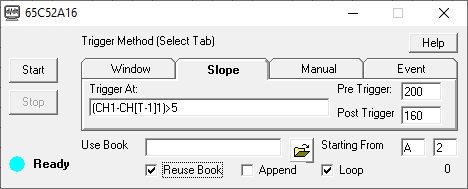

WinDaq ExcelLink
WinDaq ExcelLink (short for Advanced Trigger ExcelLink) bridges WinDaq software with Microsoft Excel. Using WinDaq ExcelLink will allow you to use Excel program to analyze WinDaq data in real time by taking WinDaq waveform data and moving it directly to a user-selected range of cells in Excel.
Installing WinDaq ExcelLink
There are two components needs to be installed. WinDaq ExcelLink and WinDaq. Please install WinDaq based on your instruments' requirement
How to Enter the Key to Your Device
If you order DI-1100XL, DI-2108XL, DI-2008XL or DI-4730-B, you can skip this step, since everything is taken care in the factory.
If you order a key for an existing instrument, please follow the steps below:
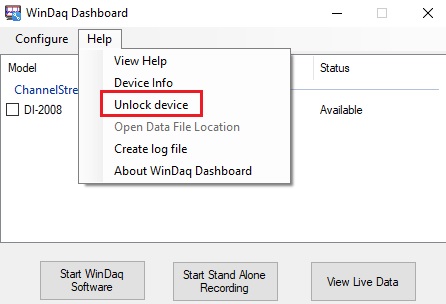
1. Run WinDaq Dashboard
2. Select the device from the list
3. Follow Dashboard->Help->Unlock Device to enter the key
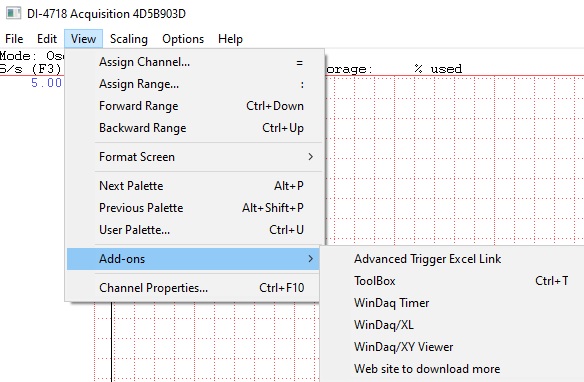
To Start WinDaq ExcelLink
To invoke ExcelLink, start WinDaq first, then follow WinDaq->View->Add-ons->Advanced Trigger ExcelLink to activate ExcelLink. WinDaq configuration should not be modified once ExcelLink starts to stream data. Stop the link before changing WinDaq configuration.
If you need to add analysis function or charting module to Excel, please create and save the work book first, then use Open Excel Book to use it. Excel doesn't like to be interrupted by user action, such as selecting live data to make a chart, while receiving data from ExcelLink.
The Basic of WinDaq ExcelLink
- Open Excel book allows user to use predefined analysis functions and charting preference to save time, here is an example on how to use the feature to add TimeStamps automatically
- Reuse Book allows user to capture the data into the same book during a session to save computer resources
- Specifies Starting cell with Max row defines the region where the data will be streamed/copied to
- Loop mode re-arms at the end of trigger
- Start links to WinDaq, Stop cuts links to WinDaq so that one can change WinDaq configuration
- Capture button manually trigger a single row/multi-row (block) of data to be sent to Excel
- A Row of data contains data from all enabled channels in WinDaq
- TimeStamp is based on the computer clock, and its resolution is 1 second
- Count (lower right corner) shows the total data rows captured in the session
- Append to the end of data from previous session instead of overwrite when checked. Due to the different max row limit of various Excel versions, ExcelLink doesn't set up a hard limit on how many rows it can store
- Help opens this page (internet connection needed)
The Trigger Methods in WinDaq ExcelLink
Even though today's Excel can store over 1,000,000 rows of data, it is still a small buffer for high speed data aquisition unless trigger modes are utilized so that only data of interests is captured. ExcelLink supports advanced math to construct various trigger methods and every data point in WinDaq is examed when evaluating the trigger conditions.- Window Trigger
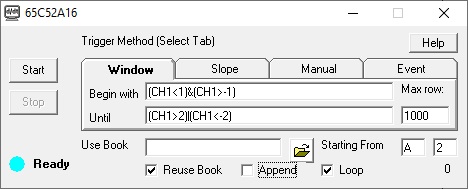
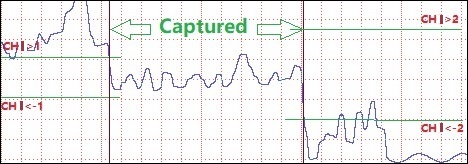
- Two trigger conditions, one for start, another for stop. For example, with begin with (CH1<1)&(CH1>-1) until (CH1>2)|(CH1<-2), data will start to stream to Excel when the reading of first channel is within the range of -1 and +1, and data will stop streaming to Excel when the reading from first channel is outside of the range of -2 to +2. Click here for more info.
- Slope Trigger
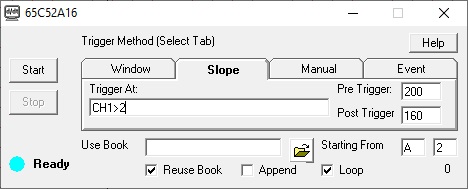
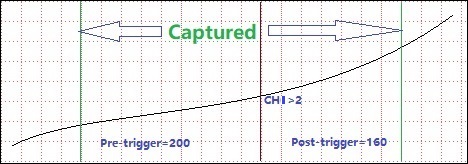
- Single trigger point includes pre-trigger and post-trigger data, and the condition must go from false to true to be considered a trigger. For example, we use trigger CH1>2, pre trigger 200 and post trigger 160, ExcelLink will wait until the reading of first channel rising through 2, before sending 200 rows of data before the trigger point and 160 rows of data after the trigger point to Excel. Click here for more info
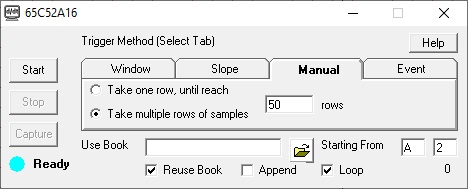
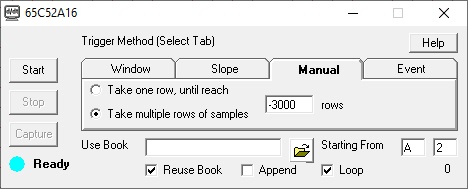
- Manual Trigger
has two options, click here for more info

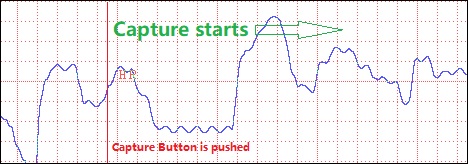
- "Take one row...", each time Capture button is pressed, ExcelLink will send one row of data to Excel, until it reaches the max row defined. Every row of data is accompanied with a timestamp
-
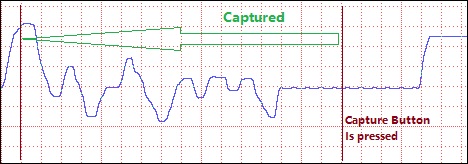
"Take multiple rows...", each time Capture button is pressed, ExcelLink will begin to send defined rows of data to Excel
if the rows is positive. If the row is negative, it captures defined number of abs(rows) up to the moment the button is pushed. For example below, it captures 3000 rows of data up the moment the button is pushed
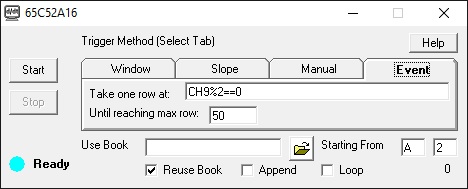
- Event Trigger

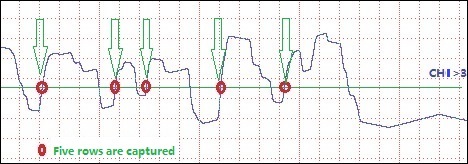
- Single trigger point, when the test against the trigger condition goes from false to true, one row of data will be sent to Excel, until max row is met. For example, with CH1>3, each time the reading on first channel goes from below 3 to higher than 3, one row of data will be sent to Excel. Click here for more info
- Derivative Trigger

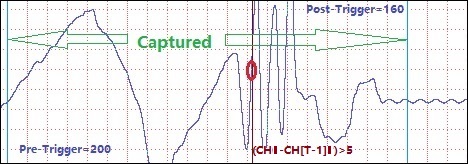
- Analog Derivative Trigger is powerful tool in data capturing. To demonstrate it, we look at a wavform swinging across the full range, we need to capture a glitch in the chart above, by using trigger condition (CH1-CH[T-1]1)>5, pre trigger 200 and post trigger 160, ExcelLink will wait until the reading of first channel has a sudden positive jump greate than 5, before sending 200 rows of data before the trigger point and 160 rows of data after the trigger point to Excel. Click here for more info.
- Paced Trigger
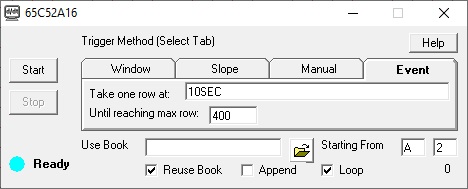
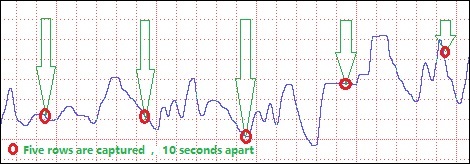
- Paced trigger is part of the Event Trigger method, instead of using math expression to specify trigger condition, use SEC notation will set the pace of data capturing. In the example, a row of data will be sent to Excel every 10 seconds. Every row of data is accompanied with a timestamp. Click here for more info.
- Delayed Trigger
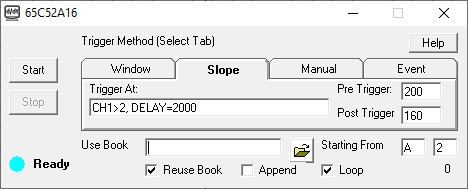
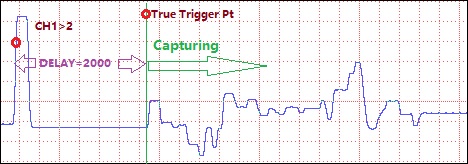
- Delayed trigger is part of the Slope Trigger method, it adds delay to the trigger point. To use this feature, add the notation DELAY= after the trigger expreesion. After this notation, there are two formats available, First is to delay in terms of WinDaq sampling interval, which is accurated down to the sampling interval, add the number of interval directly, such as "CH1>2, DELAY=2000". In this example, if WinDaq is sampling at 1ms sampling interval, the actually trigger point will be 2000 ms after channel 1 passes 2. Second is to delay in terms of second, which is calculated based on WinDaq sample rate, add the seconds with "SEC" at the end, such as "CH1>2, DELAY=2.3SEC". In this example, if WinDaq is sampling at 0.5 second interval, the actual trigger point will be 2 seconds after channel 1 passes 2, since 2 seconds is the best this WinDaq configuration can do. Click here for more info
- Digital Channel Trigger
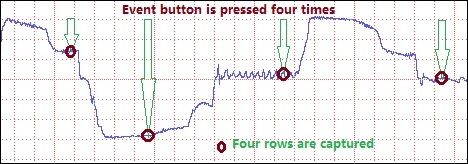
- Digital trigger is an effective method to control when to collect data by external signals, which can be pressing the event button on the instrument or being paced by counter channel. In the above example, by monitoring bit 1 of digital channel, which is the the event button status, one row of data is captured when the button is pressed. Click here for examples
How to Create a Trigger Condition
- How to Add Signals to the Math Expression
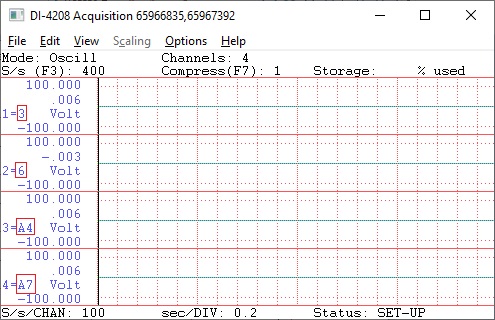
- To use readings from a channel, use CH notation, and the number matches what you see in WinDaq. In the following example, CH3, CH6, CHA4 and CHA7 are available to use
- To reference the sample rate in the math, use RATE
- To use an earlier reading from a channel, add [T-n] after CH, where n represents the sample interval, n<=16. For example CH1 is the latest reading from channel CH1, CH[T-1]1 is the reading from CH1, one sample interval earlier, CH[T-2]2 is the reading from CH2, two sample intervals earlier.
- The reading from channels matches the engineering unit of WinDaq
- Trigger Can Be Based on Analog Calculated Trigger Conditions, for examples
- (CH1*CH2)>40, can be used to calculate the power consumption based on the readings of voltage on channel CH1 and current on channel CH2
- (CH1-CH[T-1]1)>1 will catch a sudden change of greater than 1(V) on channel CH1
- CH1>1 triggers when channel CH1 is higher than 1(V)
- CH1>1 & CH2<1 triggers when channel CH1 is higher than 10 AND channe CH2 is lower than 1
- Trigger Can Be Based on Digital Calculated Trigger Conditions, click here for examples
- CH11!=CH[T-1]11, since channel 11 is the counter channel, this condition will be triggered when the count changes
- CH11%10==0, modulo operation is used, this condition will be triggered when the count is a multiple of ten, in the following example, 800, 810, 820
- True Math Expressions
-
Operators include
+ Addition - Subtraction and unary minus * Multiplication / Division ^ Power % Modulo & Logical AND | Logical OR ! Logical NOT > Greater >= Greater or equal < Smaller <= Smaller or equal != Not equal == Equal - Math functions includes: abs, sqrt, ceil, log10, sum, max, min, round
- The math equation parser uses standard English (United States) notation without the present of digital grouping symbol, the decimal point must be "." (period) instead of "," (comma).
-
Operators include
Data in Excel
To help user to better interprete the data, extra info are sent along with data for each session: The first row is the text "Sample Rate:", the row followed is the sample rate. The third row is the text "Start", and the row followed is the time stamp when the first row of data is collected. The fifth row is the list of enabled channels, followed by the matching engineering units for each channel. The real data starts at the seventh row. Due to the unpreditable number of rows in Window Trigger mode, an extra row with text "End" will be added at the end of trigger session. In the following example, starting cell is B2.
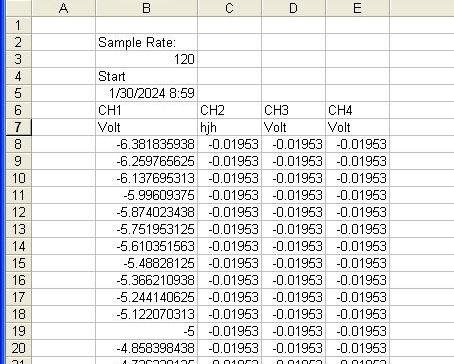
Note: the timestamp has the resolution of 1 second and it is acquired when the data is read from WinDaq
Max Limit of Rows
WinDaq ExcelLink doesn't check the limit for max number of rows, the limit of pre- and post trigger length, because different version of Excel has different row limts and different Windows has different memory allocation and transfer limit, too. If you wish to pass your configuration to your coworkers with different Excel, limit the total number of cells (row x channels) to 65000
Some Good Practice with ExcelLink
- Don't change WinDaq's configuration while streaming is live. Alway push the stop button to pause the link before changing WinDaq configuration
- Don't change Excel spreadsheet while streaming is live, Excel don't want to be interrupted while receiving data stream. Alway push the stop button to pause the link before changing Excel configuration, or use Excel workbook with predefined analysis and charting modules in place
- WinDaq ExcelLink works with older version of Excel and Windows with limitation and performance hit
Errors of ExcelLink
- If you see error message or needs to locate the configuration file, please click here for more info